Interpret durations of care
Duration projections in ODG for Disability are generated by condition and/or procedure using medical topics and codes. Interpreting projected and target disability durations is key to managing the return to work/function process. You can use this information to help set goals for RTW. Here are more details.
How to interpret durations
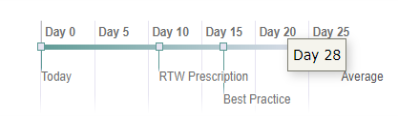
At the top of the Duration tab, the duration guidelines are represented on a dynamic timeline that provides visual cues and alerts for key RTW dates. With this timeline, the claim handler or disability clinician can better understand the projection for how long the claimant will be out of work.
Dynamic RTW timeline
-
RTW Prescription: This alert generates a work activity and RTW Prescription form based on current evidence-based information.
-
Best Practice: This is the best practice date to aim for or manage to.
-
Average: This is the benchmark date against the actual outcomes data.
-
Maximum: This is the maximum anticipated return-to-work date.
Disability duration guidelines
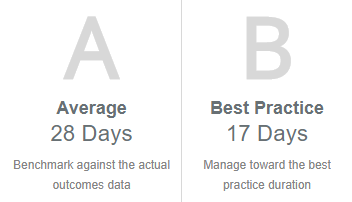
Right below the timeline, the Duration tab also provides the disability Average (A) and Best Practice (B) durations at diagnosis or claim level. The guidelines start at the diagnosis level, but you can refine durations to the claim level. This example shows the A | B values for a back pain diagnosis.
-
Value A: The A (Average) value provides the average of all lost-time claims excluding the outliers (top 5%), which better reflects a typical lost-time claim.
-
Value B: The B (Best Practice) value represents a reasonable expectation for a well- managed, top tier claim. This value is based on physiological recovery time, which is informed by the data while also undergoing an annual peer review and consensus process by the ODG Editorial Advisory Board, consisting of about 100 physicians.
To interpret disability durations for the claimant:
-
From the disability duration guidelines, view the A | B values and number of days.
-
From the timeline, view the RTW Prescription share-by date.
-
Then, evaluate the Average and Best Practice duration projections in the timeline.
Based on your findings—how long will the claimant be out of work?
To share the evidence-based information as a best practice goal for the claimant:
-
Select the RTW Prescription alert in the timeline (or use the Print > RTW Prescription option).
-
Fill out the form that opens.
-
Click Create Printable Document.
The final PDF includes a signature field for the treating doctor to sign-off on the goals and restrictions.
Best practice scenarios for durations of care
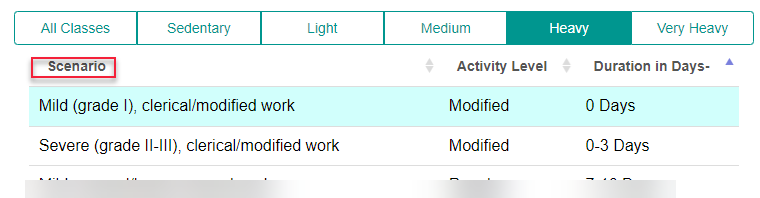
You can override this duration model by choosing a more precise best practice scenario from the Scenario table. The scenarios are broken down by severity of injury or type of work. Durations are identified based on the selected DOL Job Class (Heavy) and best practice scenario. The duration guidelines (timeline and A | B values) show the results.
View evidence-based clinical content and guidelines
To help you understand the claimant's condition, you have a few consumer-friendly educational options:
-
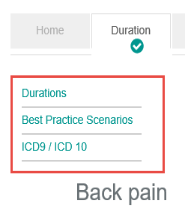
On the left side, use the index of clinical content to locate information on the Duration tab.
-
Below the condition name (Back pain), use
 to get up-to-date health information to share with claimants.
 -
Scroll down to watch a short-animated video overview on the condition. This overview also appears in the index.
-
Scroll down to view ICD codes associated with a condition or use the index (select ICD9 / ICD10). Then view the activity modifications provided for modified work and manual work, specific to the condition.
-
And even further down, view the Additional Clinical Content for Medical Topic(s) section. The layout lets you move through different views (tab or list) of all topics pinned at the top such as whiplash, back pain, and shoulder strain.
Identify claims at highest risk
On the Duration tab, next to the RTW timeline is the LTD Predictor score. This score helps you identify the relative risk level of the claim transitioning to LTD.
![]()
When you select the LTD Predictor, the LTD Transition Risk score opens.
-
Extreme: Indicates the highest risk (100%) of transitioning to LTD, so RTW during the STD time frame is unlikely.
-
High: Indicates a high risk (80%) of transitioning to LTD, so RTW during the STD time frame is unlikely.
-
Cautionary: Indicates a considerable risk (60%) of transitioning to LTD, so RTW during the STD time frame should occur.
-
Moderate: Indicates a relatively low risk (40%) of transitioning to LTD, so RTW during the STD time frame is likely.
-
Low: Indicates a low risk (20%) of transitioning to LTD, so RTW during the STD time frame is likely.
Based on your findings, what is the outcome?
Should the claim be assigned to a higher skilled resource to help facilitate claim movement and help control variability?
Should the claim go to auto-pay and close (simple surgery or maternity)?
Is LTD needed for the claimant?
For more information, see ODG Disability and RTW Durations in the Resource Library.